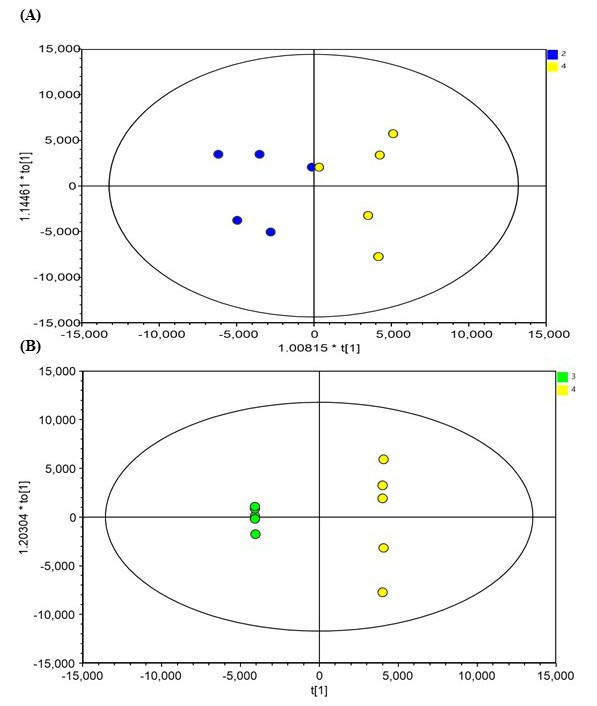
Fig. 3. Orthogonal partial least squares (OPLS-DA) Mix Scores Plot analysis of total lipidome (analysed in positive ion mode) profile 24 hours post thaw of HL-60 cells (n= 5). Cell were cryopreserved in DMSO + Nig [2: Blue circles] (A) or in DMSO +Sal [3: Green circles] (B) compare to cells frozen DMSO + Nig and Sal [4: Yellow circles].